Genome-wide association analyses of borderline personality disorder identify 11 loci and highlight shared risk with mental and somatic disorders
Nature.com·July 20, 2026
AI Summary
Researchers identified 11 genetic loci associated with borderline personality disorder through genome-wide association analyses. The study reveals significant genetic overlap between borderline personality disorder and other psychiatric conditions, behavioral traits, and physical health disorders.
Borderline personality disorder (BPD) is a severe mental health condition influenced by environmental risk factors (for example, interpersonal trauma) and genetic factors. We conducted the largest genome-wide association study (GWAS) meta-analysis of BPD so far, with a discovery sample of 12,339 cases and 1,041,717 controls, and a replication study of 685 cases and 107,750 controls (all participants of European ancestry). We identified 11 independent associated genomic loci and 9 risk genes in gene-based analyses. We observed a single-nucleotide polymorphism heritability of 17.3% and derived polygenic scores (PGS) that predicted 4.6% of the phenotypic variance in BPD on the liability scale. BPD showed the strongest positive genetic correlations with GWAS of post-traumatic stress disorder, depression, attention deficit hyperactivity disorder, antisocial behavior, and measures of suicide and self-harm. Phenome-wide analyses in Vanderbilt University Medical Center Biobank and UK Biobank using BPD-PGS confirmed these associations and also identified associations with other medical conditions, including obstructive pulmonary disease and diabetes. These analyses highlight BPD as a polygenic disorder, with the genetic risk showing substantial overlap with psychiatric and physical health conditions.
BPD is a mental disorder characterized by pervasive instability in emotions, interpersonal relationships and self-image as well as impulsive behavior1,2 (for symptoms, see Supplementary Note). BPD has a prevalence of 0.92–1.90% in Western countries3, with symptom onset typically occurring during adolescence. Women are more frequently diagnosed with BPD than men by a ratio of ~3:1, for which a substantial contribution of diagnostic as well as selection bias has been postulated4,5. Individuals with BPD display high rates of self-harm, suicidal ideation and suicide attempts. BPD shows substantial symptom overlap and comorbidity with other mental disorders5,6, and comorbidity with neurological and somatic health conditions6,7. Although some psychotherapies are effective in treating BPD8, no psychopharmacological treatments have been approved by the US Food and Drug Administration specifically for BPD2,9.
In addition to environmental risk factors such as early interpersonal trauma10,11, genetic factors contribute substantially to disorder risk. Twin and family studies estimate the heritability of BPD to be 46–69%12,13 and demonstrate that the genetic risk for BPD is partially shared with other mental disorders but also with continuous traits; for example, the Big Five personality traits14,15. However, a systematic assessment of shared genetic risk with a broad range of disorders and traits is missing.
Full story reconstructed from Nature.com. Formatting and media may differ from the original.
For many mental disorders, GWAS meta-analyses of genetic data from tens or hundreds of thousands of cases and controls have successfully identified hundreds of genetic risk loci16. By contrast, genetic research on BPD lags behind17. In the only GWAS of BPD conducted so far, encompassing 998 cases and 1,545 controls18, no single genome-wide significant variants were identified, but significant genetic correlations (rg) of BPD were observed with bipolar disorder (BIP), schizophrenia (SCZ) and major depressive disorder18. Although these findings indicate the potential of using genetic approaches to investigate BPD, research based on those results is limited by large uncertainties in the estimated effect sizes. Additionally, the extent to which sex-specific genetic effects contribute to the observed sex differences in the prevalence and clinical characteristics of BPD remains unclear.
The main aims of the present study were to identify novel genetic risk loci for BPD to improve understanding of the underlying molecular mechanisms and to systematically assess the shared genetic risk between BPD and a broad range of related traits and disorders.
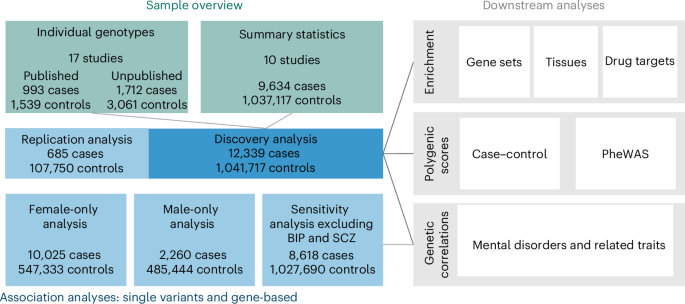
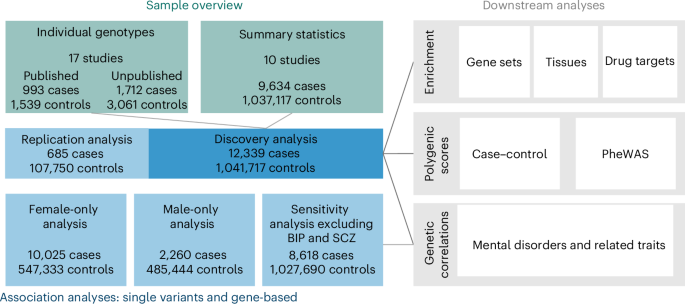
We performed a discovery GWAS meta-analysis, including 6,043,895 genetic markers in 12,339 BPD cases and 1,041,717 controls for individuals of European ancestry (Fig. 1). In total, 17 studies contributed individual-level data for a total of 2,705 cases meeting the fourth edition of the Diagnostic and Statistical Manual of Mental Disorders (DSM-IV) criteria for BPD and 4,600 controls, which were combined into five datasets. Additionally, 10 large-scale biobank or cohort studies provided summary statistics from GWAS of BPD (ncases = 9,634; ncontrols = 1,037,117). In these, BPD status was assessed using International Classification of Disease (ICD) codes, except for the Genetic Links to Anxiety and Depression (GLAD) study, which used a self-reported diagnosis. Details on ascertainment, along with inclusion and exclusion criteria, are documented in Supplementary Table 1. Sample sizes, basic demographics (sex and age), depression comorbidity and analysis details are provided in Supplementary Table 2 and Supplementary Note. Additionally, we performed meta-analyses stratified by sex (female only, male only) and a sensitivity analysis excluding individuals with a history of BIP or SCZ—conditions commonly excluded in BPD studies—based on summary statistics available from the studies providing summary statistics (Supplementary Tables 3–5). To assess replication, the lead single-nucleotide polymorphisms (SNPs) and PGS derived from the discovery analysis were tested in two independent datasets (total ncases = 685; total ncontrols = 107,750). Additionally, SNPs with P < 1 × 10⁻⁶ in the discovery GWAS were analyzed in a combined meta-analysis (ncases = 13,024; ncontrols = 1,149,467). The discovery GWAS had over 80% power to detect effects of 1.1 for variants with an allele frequency between 0.3 and 0.7 (ref. 19; Supplementary Table 6 and Supplementary Fig. 1).
A total of 17 studies providing individual-level data (analyzed in five datasets) and ten studies providing summary statistics were included in the discovery meta-analysis. Genetic associations were tested at the single-variant and gene level. Gene enrichment analyses were applied to test for enrichment in gene sets and tissue-specific gene expression data from 54 human tissues (GTEx), comprising 29 different ages and 11 general developmental stages (BrainSpan), single-cell-based cell types and drug-target gene sets. PGS were calculated to assess the prediction of BPD case–control status in the analyzed datasets with available individual-level data and to test the association of the genetic liability for BPD in phenome-wide association studies with phecodes in two biobanks (BioVU, UKB). Genetic correlations were calculated between the results of the GWAS of BPD and the GWAS of 50 disorders and traits of interest.
We observed a SNP heritability of 28.4% (95% confidence interval (CI), [24.9%, 31.8%]), corresponding to a SNP heritability of 17.3% (95% CI, [15.2%, 19.4%]) on the liability scale (assuming a population prevalence of 1.5%)3. The linkage disequilibrium score regression (LDSC)20 intercept was 1.03 (s.e. = 0.0085), with an attenuation ratio of 0.11 (s.e. = 0.031), and we observed a genomic inflation factor (λGC) of 1.22 (λ1000 = 1.01). There was a high genetic correlation between the studies with individual-level data and those providing summary statistics (rg = 0.85; 95% CI, [0.68, 1.03]; P = 3.5 × 10⁻²¹), which was significantly smaller than 1 (z = −1.76; P = 0.038).
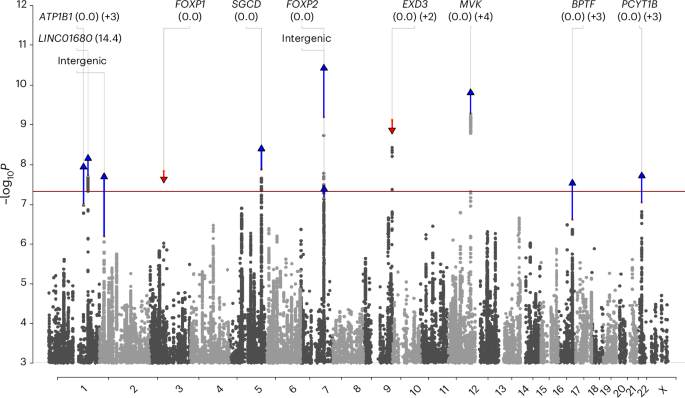
SNP association analysis revealed six independent genome-wide significant loci (P < 5 × 10⁻⁸; Fig. 2, Table 1, Supplementary Figs. 2–14 and Supplementary Table 7), and no marker showed significant heterogeneity between studies after multiple testing correction (smallest heterogeneity P = 0.023). All 6 genome-wide significant lead SNPs (6 out of 6, P = 0.016; Table 1), and 77% of the lead SNPs associated with P < 1 × 10⁻⁶ (24 out of 31, P = 0.0017) showed effects in the same direction in the replication analysis. In the combined analysis, the 6 loci remained genome-wide significant, and 5 additional loci with P < 5 × 10⁻⁸ were observed (Fig. 2, Table 1 and Supplementary Figs. 2–24).
The two-sided −log10P value for each SNP in the discovery GWAS (inverse-variance-weighted meta-analysis; ncases = 12,339; ncontrols = 1,041,717) is indicated on the y axis (chromosomal position shown on the x axis). The red horizontal line indicates genome-wide significance (P < 5 × 10⁻⁸). Index SNPs representing independent genome-wide significant associations either in the discovery GWAS or the combined analysis (ncases = 13,024; ncontrols = 1,149,467) are highlighted (upward-pointing blue triangle, increased significance in combined analysis; downward-pointing red triangle, reduced significance in combined analysis). Combined P values are plotted for lead loci, and vertical lines indicate the P value change from the discovery to the combined analysis.
Gene-based association analyses using MAGMA (v.1.07)21,22 implicated nine genes, including CCDC71 and DEPDC1B, in addition to SGCD, FOXP2, EXD3, MVK, MMAB, PCYT1B and BPTF already implicated by the genome-wide SNP associations (Extended Data Fig. 1, Supplementary Fig. 25 and Supplementary Table 8).
Among the genes implicated by proximity to lead SNPs or by the gene-based analysis, the highest polygenic priority scores (PoPS)23 were observed for FOXP2 (score, 0.96; rank, 1) and SGCD (score, 0.74; rank, 2), with FOXP1 and DEPDC1B also ranking in the top 1% (Supplementary Table 9). Of the genes in proximity to loci that reached significance in the combined analysis, NME7 and KPNA2 ranked highest (top 5%).
We carried out sex-stratified GWAS meta-analyses for male (ncases = 2,260; ncontrols = 485,444) and female study participants (ncases = 10,025; ncontrols = 547,333) (Supplementary Tables 3 and 4). We used sex-specific population prevalences of 2.25% for females and 0.75% for males to convert heritability estimates to the liability scale4,5. For females, we observed a SNP heritability of 30.3% (95% CI, [26.1%, 34.5%]), corresponding to 20.5% (95% CI, [17.7%, 23.4%]) on the liability scale. For males, the observed SNP heritability was 19.8% (95% CI, [7.9%, 31.6%]), corresponding to 10.2% (95% CI, [4.1%, 16.3%]) on the liability scale, which was significantly lower than in females (z = −3.32; P = 0.00090). There was a high genetic correlation between the two analyses (rg = 0.80; 95% CI, [0.53, 1.07]; P = 4.7 × 10⁻⁹), which did not differ from 1 (z = −1.60; P = 0.055).
The female-only analysis identified one genome-wide significant risk locus on chromosome 9 (rs73581580; odds ratio (OR), 0.89; 95% CI, [0.85, 0.92]; P = 2.83 × 10⁻⁸; locus 5 identified in the main analysis (EXD3) and a second locus on chromosome 7 (rs10227454; OR, 0.87; 95% CI, [0.83, 0.92]; P = 4.99 × 10⁻⁸), ~1 Mb from locus 4 (FOXP2, r2 = 0.005, D′ = 0.25; Extended Data Fig. 2, Supplementary Figs. 26–30 and Supplementary Table 10). The gene-based analysis identified genome-wide associations for DEPDC1B, SGCD, MVK and MMAB, all significant in the main analysis (Extended Data Fig. 3 and Supplementary Fig. 31).
The male-only analysis identified two genome-wide significant risk loci that were not genome-wide significant in the main analysis: one on chromosome 2 (rs17757829; OR, 0.68; 95% CI, [0.59, 0.77]; P = 1.02 × 10⁻⁸) and one on chromosome 20 (rs6032676; OR, 0.83; 95% CI, [0.77, 0.88]; P = 9.55 × 10⁻⁹) (Extended Data Fig. 4, Supplementary Figs. 32–36 and Supplementary Table 11). The gene-based analysis identified no significant genes (Extended Data Fig. 5 and Supplementary Fig. 37).
The six lead SNPs of the main GWAS showed comparable effects and at least nominal significance in the smaller, and therefore lower-powered, sex-stratified analyses (Extended Data Fig. 6 and Supplementary Table 12). The nine genes significant in the gene-based analysis of the main GWAS all showed nominal significance in the female-only analysis (all Pfemale < 8.15 × 10⁻⁵), whereas CCDC71, DEPDC1B and SGCD were not significant in the male-only analysis (Supplementary Table 13).
In the sensitivity analysis excluding individuals with BIP or SCZ (ncases = 8,618; ncontrols = 1,027,690), locus 4 in FOXP2 (rs4727799) and locus 5 in EXD3 (rs73581580) from the main analysis were the only genome-wide significant associations (Extended Data Fig. 7, Supplementary Figs. 38–42 and Supplementary Table 14). All six lead SNPs of the main GWAS showed comparable effects (all Psensitivity < 3.32 × 10⁻⁵; Extended Data Fig. 6 and Supplementary Table 12). Of the nine genes that reached significance in the gene-based analysis of the primary analysis, all remained nominally significant in the sensitivity analysis (Psensitivity < 0.0021; Supplementary Table 13), with FOXP2, EXD3, MMAB and MVK reaching genome-wide significance, and ZNF626 being the only additional genome-wide significant gene (Extended Data Fig. 8 and Supplementary Fig. 43).
Enrichment of gene sets and tissue expression using Genotype-Tissue Expression (GTEx; v.8) data for 54 tissue types24 and expression data from 29 different ages and 11 general developmental stages (BrainSpan)25 was tested with MAGMA (v.1.07)21 as implemented in FUMA22. One significant gene set was identified: the S1P–S1P3 (sphingosine-1-phosphate–sphingosine-1-phosphate receptor 3) pathway26 (29 genes; standardized effect size β = 0.03; P = 1.91 × 10⁻⁶; Padj = 0.018; Supplementary Table 15). Nominally significant enrichment was observed in several GTEx tissue types, with the most significant enrichment in cerebellar tissue (not significant after correction for multiple testing; all Padj > 0.32; Supplementary Fig. 44 and Supplementary Table 16). The analysis using the two BrainSpan datasets indicated the strongest enrichments 8–21 weeks post conception (not significant after correction; all Padj > 0.09) and in early-to-mid prenatal phases, respectively (Padj < 0.025; Supplementary Figs. 45 and 46 and Supplementary Tables 17 and 18).
Analyses based on Human Brain Atlas single-nucleus RNA sequencing data27 showed SNP-h2 enrichment using stratified LDSC28,29 in 2 out of the 31 tested superclusters (‘medium spiny neurons’: enrichment = 5.99, z = 3.58, P = 0.00017, Padj = 0.0054; and ‘LAMP5-LHX6 and Chandelier cells’: enrichment = 5.50, z = 3.53, P = 0.00021, Padj = 0.0064; Supplementary Fig. 47 and Supplementary Table 19).
Of the 16 genes prioritized from the discovery GWAS meta-analysis through proximity to the six GWAS loci or in the gene-based test, none were highlighted as drug targets by Open Targets, although several showed potential tractability (Supplementary Fig. 48). The Genome for REPositioning drugs (GREP) pipeline revealed no significant enrichment for drug targets across any ICD or ATC category. The Drug–Gene Interaction Database (DGIdb) highlighted drug–gene interactions for MYO1H with lithium, MVK with alendronate sodium and PCYT1B with the unapproved substances CT-2584 and sphingosine. In an additional analysis with DRUGSETS30, based on MAGMA, testing the enrichment of the GWAS associations in 735 drug–gene sets; the most significant drugs included medications for neurological conditions (safinamide, gabapentin, lomerizine, oxcarbazepine), pain (prilocaine, tetracaine) and alcohol dependence (acamprosate), but also medications for metabolic or somatic conditions (Supplementary Table 20; all Padj > 0.18).
PGS for BPD were calculated using PRS-CS31 in the datasets for which individual-level genotype information was available using leave-one-out summary statistics, excluding the respective sample from the discovery GWAS. In addition, we calculated PGS in the two independent replication datasets (Methods). For comparison, PGS were additionally calculated based on the 2017 BPD GWAS18. The explained variance was converted to the liability scale (population prevalence, 1.5%)3.
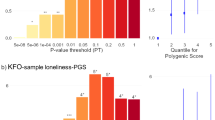
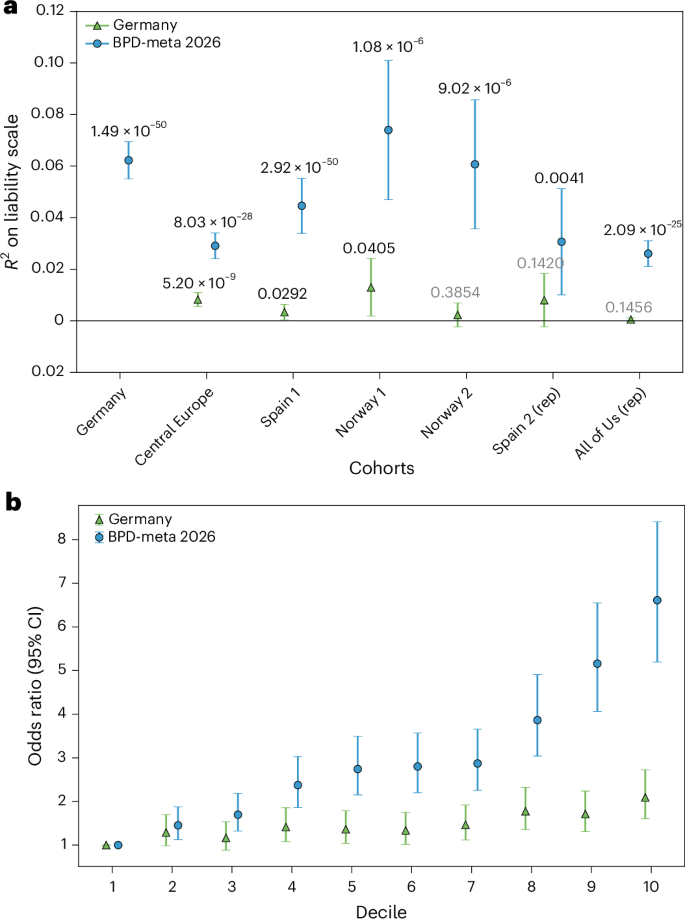
PGS explained a weighted average of 4.6% (area under the receiver operator characteristic curve (AUC) = 66.0%) of the phenotypic variance on the liability scale (assuming a lifetime prevalence of 1.5%)3 in the five datasets included in the discovery meta-analysis (Fig. 3 and Supplementary Table 21). In the independent replication samples, PGS explained 3.1% of the variance (P = 0.0041; AUC = 62.4%) in Spain 2 and 2.6% in All of Us (P = 2.09 × 10⁻²⁵; AUC = 61.4%). The OR for BPD case–control status comparing the highest PGS decile to the lowest decile was 6.61 (95% CI, [5.20, 8.41]) for PGS based on the current meta-analysis, compared to OR = 2.09 (95% CI, [1.60, 2.72]) for PGS based on the 2017 GWAS. When comparing to the middle 10% of the distribution, we observed an OR of 2.37 (95% CI, [1.94, 2.89]) for the highest decile for PGS based on the current meta-analysis and an OR of 1.44 (95% CI, [1.05, 1.98]) for PGS based on the 2017 GWAS.
a, The proportion of variance in case–control status explained by the PGS on the liability scale (y axis; Liability R2). b, OR for BPD by PGS deciles, with decile 1 as reference. Leave-one-out PGS were calculated for the datasets with available individual-level genotype, including Germany (ncases = 993; ncontrols = 1,539), Central Europe (ncases = 1,285; ncontrols = 1,332), Spain 1 (ncases = 306; ncontrols = 759), Norway 1 (ncases = 57; ncontrols = 700) and Norway 2 (ncases = 64; n = 270 controls), and for two independent replication (rep) datasets: Spain 2 (replication; ncases = 46; ncontrols = 435) and All of Us (replication; ncases = 639 cases; ncontrols = 107,315) (Supplementary Tables 1 and 2) using PRS-CS. For each prediction, the respective dataset was excluded from the used discovery GWAS meta-analysis (ncases = 12,339; ncontrols = 1,041,717), while the full sample size was used for the two replication datasets (blue circles, 2026 meta-GWAS). To visualize the increase in variance explained by the PGS, we also calculated PGS based on the first published BPD GWAS, consisting of the Germany sample (green triangles, 2017 GWAS; ncases = 993; ncontrols = 1,539)18. In a, two-sided P values shown above each upper error bar were obtained from logistic regression assessing the associations between PGS and BPD case–control status. Nagelkerke’s pseudo-R2 was computed by comparing the full model (including PGS and ancestry principal components) with a reduced (covariate-only) model. The explained variance was converted to the liability scale of the population, assuming a lifetime disease risk of 1.5%. Error bars in a, s.e.m. of the proportion of variance in liability (Liability R2) explained by the PGS. The analysis presented in b excluded the All of Us dataset, as its individual-level data could not be merged with the other datasets owing to data protection regulations. Error bars in b, 95% CI.
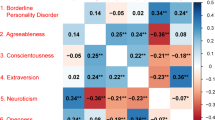
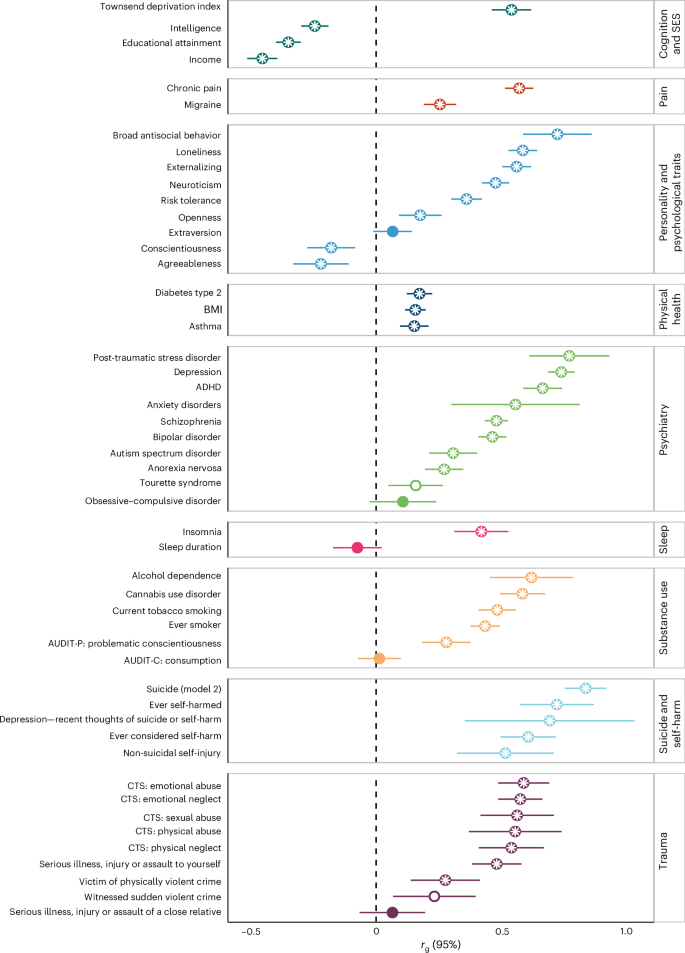
In a targeted approach, we calculated genetic correlations with a selection of 50 GWAS of other disorders and traits relevant to BPD, including mental disorders, suicide, self-harm, trauma, substance use, physical health, pain, sleep, personality traits (Big Five GWAS including data from 23andMe) and cognition. After Bonferroni correction for multiple testing (α = 0.05/50 = 0.001), BPD showed significant genetic correlations with 43 out of the 50 tested phenotypes. Among the psychiatric disorders, BPD showed the strongest correlations with post-traumatic stress disorder (PTSD) (rg = 0.77; 95% CI, [0.61–0.93]; P = 2.97 × 10⁻²¹), depression (rg = 0.74; 95% CI, [0.69–0.79]; P = 6.06 × 10−163) and attention deficit hyperactivity disorder (ADHD) (rg = 0.67; 95% CI, [0.59–0.75]; P = 7.20 × 10−63). In the other domains, substantial genetic correlations with |rg| > 0.5 included material deprivation, chronic pain, broad antisocial behavior, loneliness, externalizing traits, measures of suicide, self-harm and trauma. Lower but significant genetic correlations (rg < 0.18) were observed for the somatic disorders type 2 diabetes and asthma, and for body mass index (Fig. 4 and Supplementary Table 22).
Genetic correlations of BPD (total ncases = 12,339; ncontrols = 1,041,717) with 50 disorders and traits: within each group, disorders and traits are sorted by their genetic correlation. Data are presented as point estimates (genetic correlations) with error bars indicating 95% CIs. Two-sided significance of the genetic correlation is indicated by a white dot (P < 0.05) or a white star (P < 0.001; 0.05/50 tested correlations). Source and sample size of the used GWAS, as well as the exact P values of the tested genetic correlations, are listed in Supplementary Table 22. SES, socioeconomic status. AUDIT, Alcohol Use Disorders Identification Test; BMI, body mass index; CTS, Childhood Trauma Screener.
The sensitivity meta-analysis excluding individuals with BIP or SCZ showed comparable genetic correlations (Supplementary Fig. 49 and Supplementary Table 23) with the 50 disorders and traits. Notably, lower but still substantial genetic correlations were observed with BIP (rg = 0.35; 95% CI, [0.28, 0.42] versus rg = 0.47; 95% CI, [0.41–0.53]) and SCZ (rg = 0.36; 95% CI, [0.31,0.41] versus rg = 0.48; 95% CI, [0.43, 0.53]). The genetic correlation of the main meta-analysis and the sensitivity analysis showed rg = 1.00 (95% CI, [0.98, 1.02]; P < 1 × 10−308).
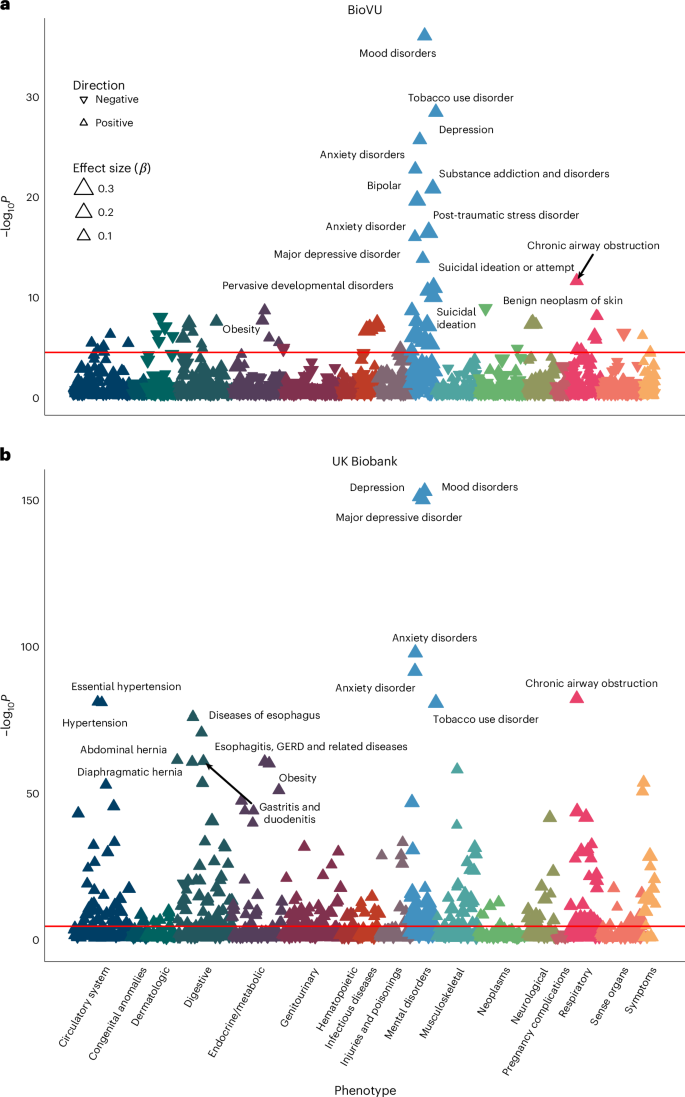
Complementing the targeted genetic correlation analysis, we characterized the genetic signal identified in the BPD GWAS by performing two phenome-wide association studies (PheWAS). To this end, we tested the association of BPD-PGS (using PRS-CS31; excluding each target sample from discovery) with ‘phecodes’; that is, medical phenotypes based on ICD diagnoses documented in the electronic health records (EHR), using data from the Vanderbilt University Medical Center Biobank (BioVU)32 (66,325 individuals; 214 with the phecode 301.20: ‘antisocial/borderline personality disorder’) and Hospital Episode Statistics in the UK Biobank (UKB) (316,635 individuals; 211 with the phecode 301.20) (Fig. 5).
a,b, Association of BPD-PGS with 1,431 tested phecodes in BioVU (a) and 1,250 Hospital Episode Statistics phecodes in UKB (b). The two-sided statistical significance (−log10P) from the logistic regression models is plotted on the y axis, and diagnoses are grouped by category. The red line indicates the Bonferroni-corrected significance threshold for the tested phecodes (BioVU: P < 3.49 × 10⁻⁵ (0.05/1,431); UKB: P < 4.00 × 10⁻⁵ (0.05/1,250 )). The top 15 associations of each PheWAS are annotated. Upward-pointing triangles indicate positive associations, and downward-pointing triangles indicate negative associations. The size of the triangles indicates the effect size (β).
In the PheWAS analysis in BioVU, 69 out of the 1,431 tested diagnoses showed an association with BPD-PGS after Bonferroni correction (Padj < 0.05; Supplementary Table 24). BPD-PGS showed the most statistically significant associations with codes from the mental disorders category (Extended Data Fig. 9), including mood disorders, substance use disorders, anxiety, PTSD and suicidal ideation or attempt. Associations were also observed in other categories, including neurological (for example, epilepsy) and somatic disorders (for example, type 2 diabetes, chronic airway obstruction, hypertension) and pain disorders and symptoms.
In the PheWAS analysis in the UKB, 317 out of the 1,250 tested diagnoses showed an association with BPD-PGS (Padj < 0.05; Supplementary Table 25). BPD-PGS showed the most statistically significant associations with codes from the mental disorders category (Extended Data Fig. 10), including mood disorders, tobacco use disorders and anxiety disorders. As in BioVU, significant associations after Bonferroni correction were observed in other categories, including respiratory (for example, chronic airway obstruction), digestive (for example, esophagus, gastroesophageal reflux disease), circulatory, endocrine/metabolic and neurological diagnoses, as well as pain disorders and symptoms.
Of the 69 diagnoses that were significant in the BioVU, 56 were also present with sufficient case numbers in the UKB. Of these, 51 showed effects in the same direction, and 41 also reached significance in the UKB (Padj < 0.05). In both samples, the phecode 301.20 (‘antisocial/borderline personality disorder’) showed the strongest effect size (ORBioVU = 1.41; 95% CI, [1.24, 1.63]; P = 7.61 × 10⁻⁷; ORUKB = 1.54; 95% CI, [1.34, 1.76]; P = 5.82 × 10⁻¹⁰).